
This section provides a snapshot of store performance, sales trends, and customer activity for a selected time period. It helps admins track business health using key performance indicators (KPIs), sales breakdowns, and leaderboard insights.
To view the Out of Stock Report, follow these steps:
- Navigate to the sidebar menu and select ‘Reports & Analytics’.
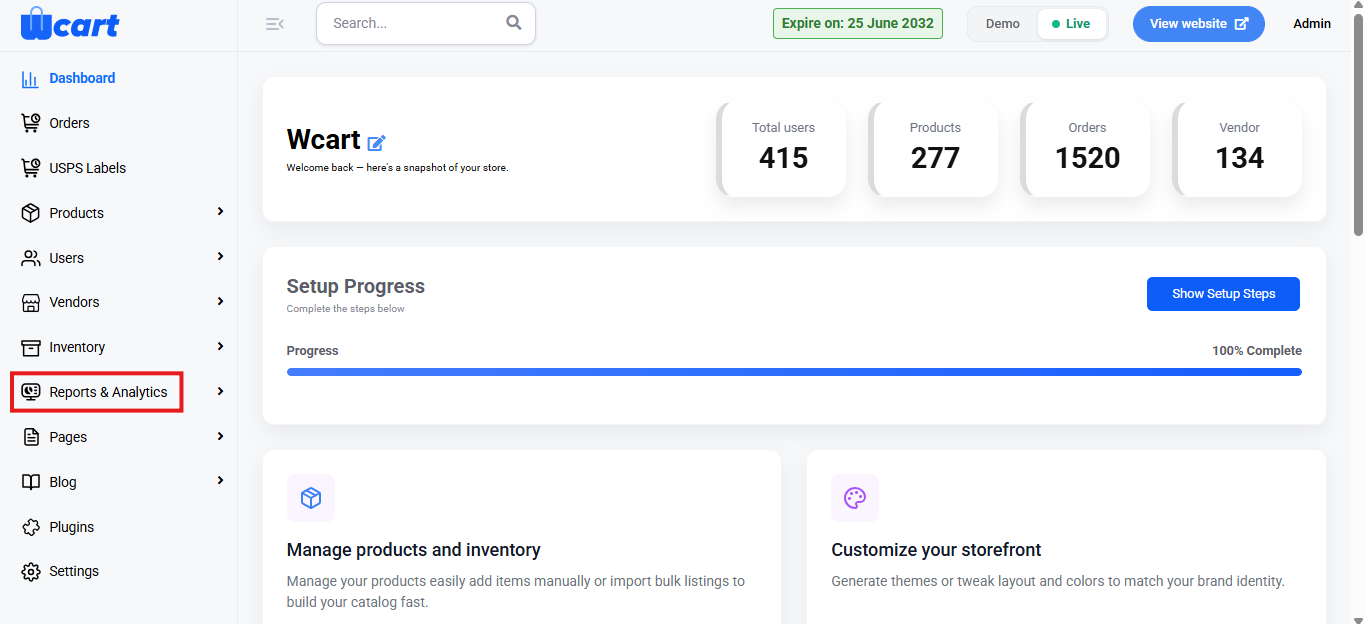
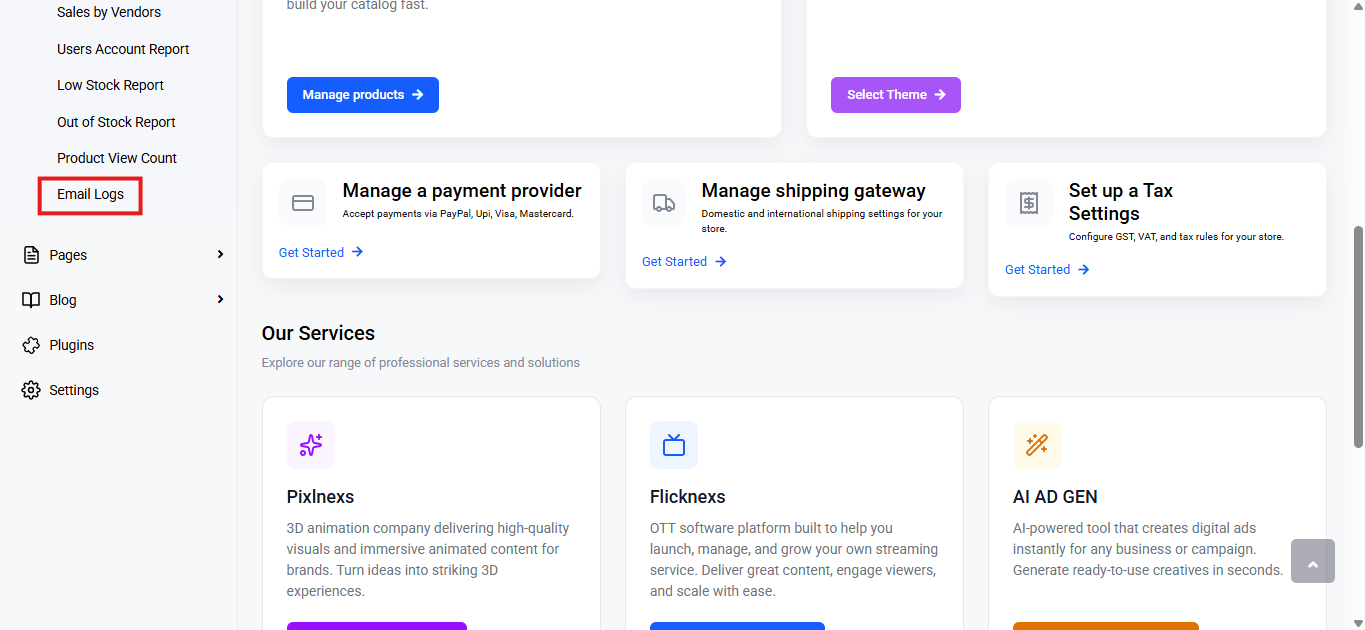
- Select ‘Overview’ from the submenu.
Range Selector
- Purpose: Allows you to filter the dashboard data based on a specific time period.
- Options Available:
- Today
- Yesterday
- This Week
- Last Week
- This Month
- Last Month
- Custom Range: Select Custom Range to filter data for a specific period.
- Choose start (From) and end (To) dates.
- Click Submit to apply.
- All reports will update based on the selected range.
When a range is selected, all data in the dashboard is updated accordingly.
Performance Summary
Located at the top, this section shows high-level performance metrics:
- Total Sale Amount: Sum of all orders placed during the selected period.
- Total Orders: Number of orders placed.
- Product Sold: Total quantity of products sold.
Each metric is color-coded for quick visual identification.
Sales & Orders Breakdown
This section displays time-based trends in both Sales and Orders.
View Modes:
- Chart View (default) – Visual representation using bar or line graphs (when data is available).
- Table View – Tabular format showing:
- Hour / Minutes
- Orders
- Order Earnings
Use the View Mode toggle on the top-right to switch between Chart and Table.
Leaderboards
The Leaderboard section highlights top performers based on product sales and user activity.
Segments:
- Top Categories – Items Sold
Displays the best-performing categories with:
- Category name
- Number of items sold
- Net sales
- Top Products – Items Sold
Highlights individual products with:
- Product name
- Items sold
- Net sales
- Best Sellers: Shows users (vendors/sellers) with the highest order count and net sales.
- Top Users: Displays customers/users with the most orders and net sales contribution.
This section gives a clear snapshot of store performance for any selected time range. With KPIs, sales trends, and leaderboards, it helps admins quickly monitor business health, identify top-performing products, categories, and users, and make informed decisions based on real-time data.